Gauge level
—
Waiting for the OPW feed
Gauge height, not water depth.

Alex’s river notebook / Ballymahon
Check the water. Find your feature.
Leave some time for another run.
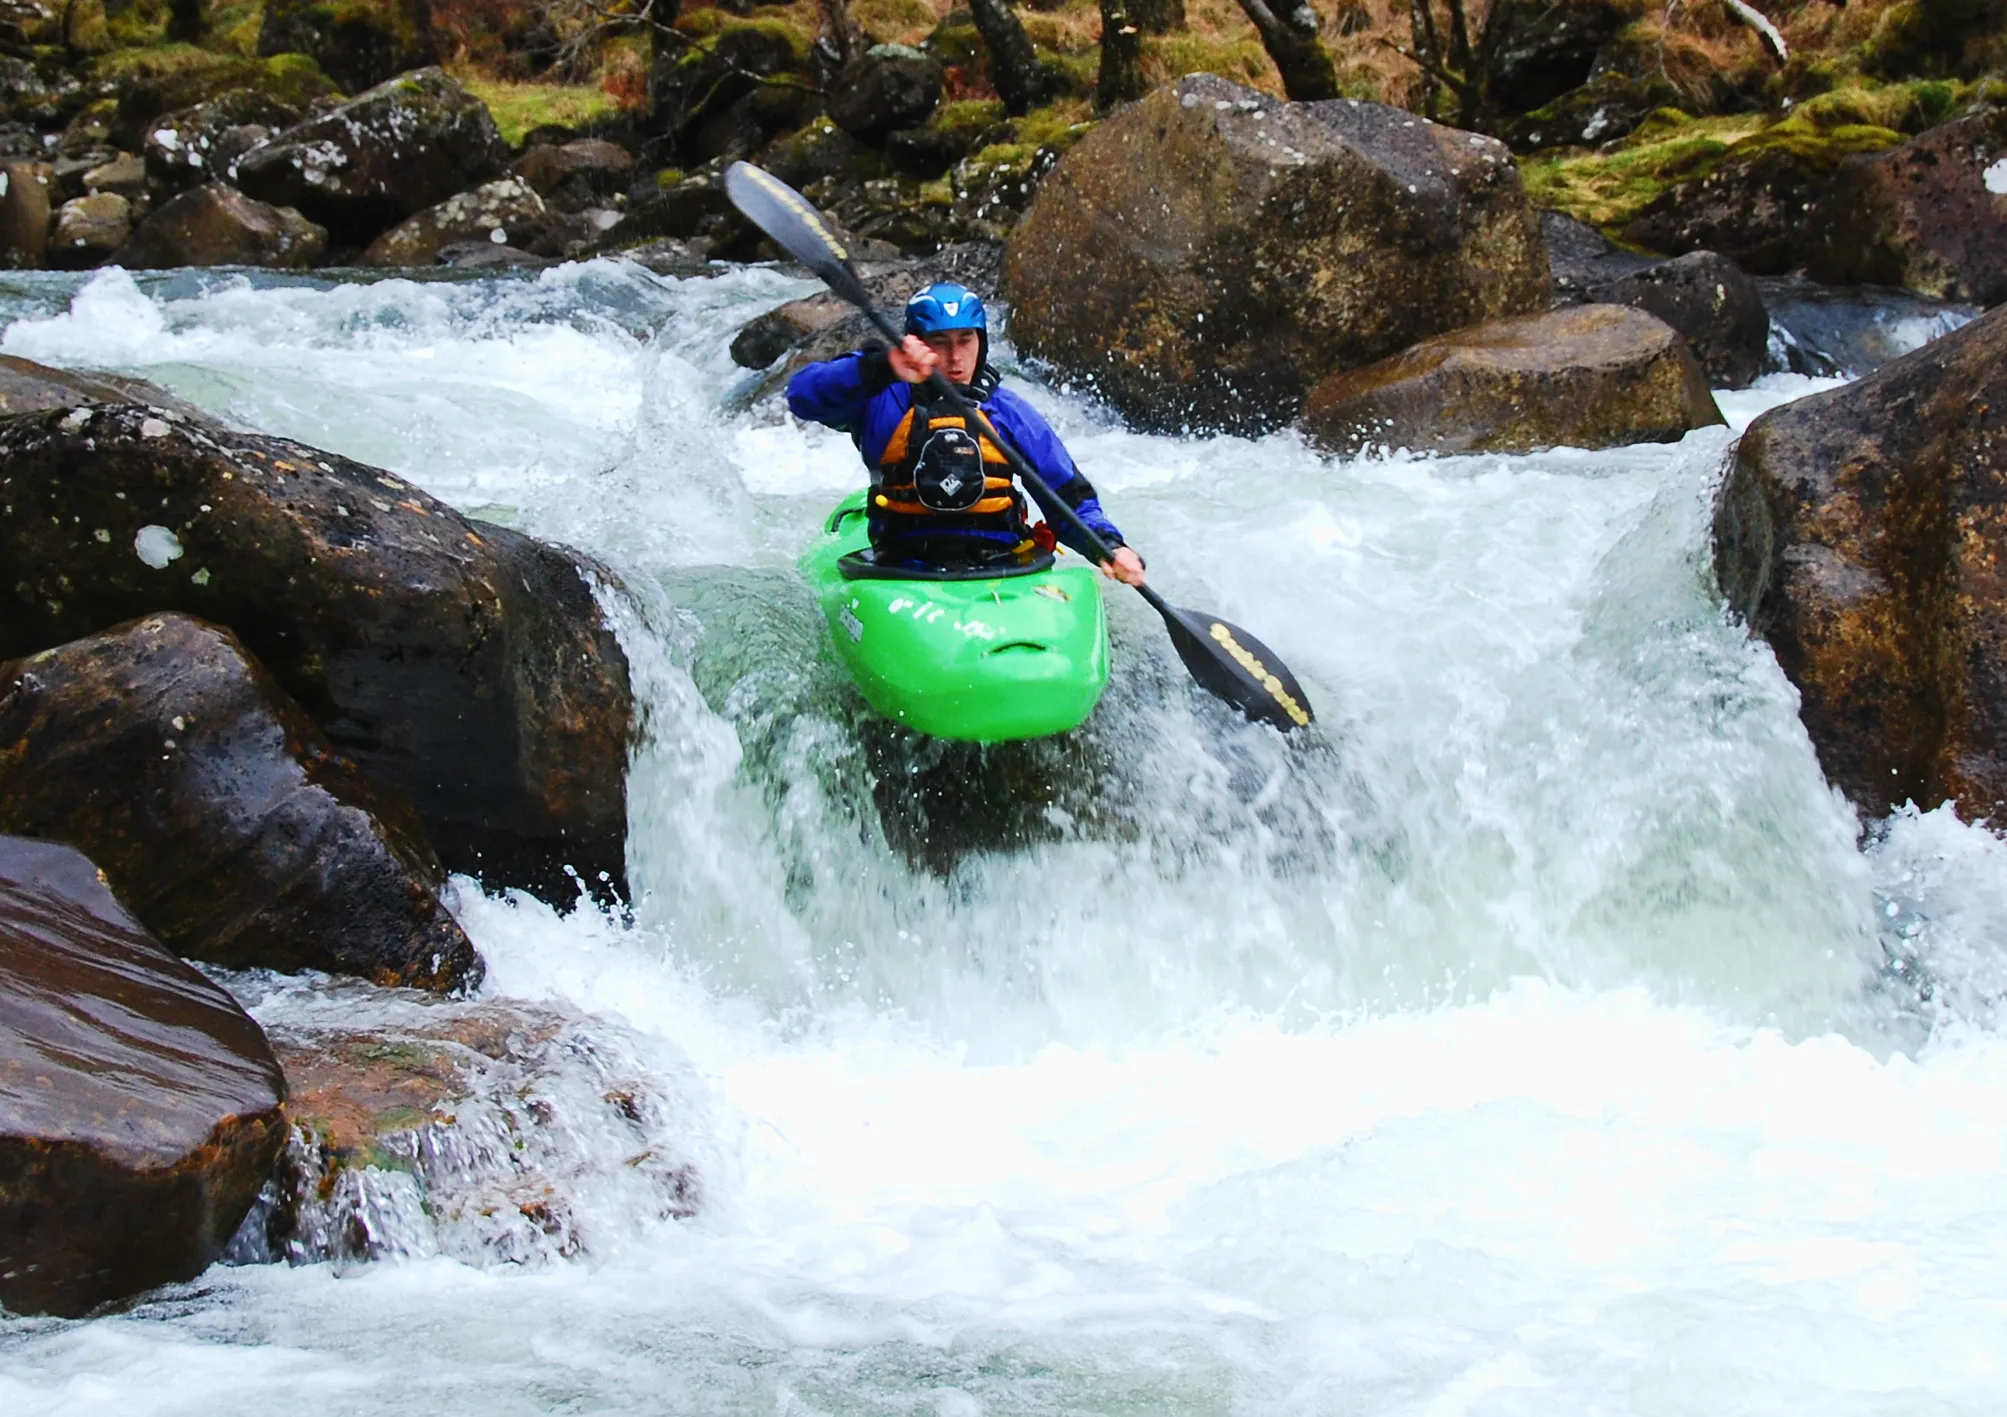
Ballymahon · River Inny
Loading the latest available OPW observations…
—
Waiting for the OPW feed
Gauge height, not water depth.
—
Waiting for the OPW feed
OPW discharge estimate.
—
Compared with an earlier reading
Observed change.
—
Waiting for the OPW feed
Sensor heating can affect this value.
Up to five years at a time. Recent ranges use source readings; older ranges use daily means.
Nearby rainfall · Mount Dillon · approximately 24 km away
Observed hourly rainfall from Met Éireann. This is regional context, not rainfall measured along the Inny or a forecast of its flow. The live feed has limited retention; its actual coverage is shown below. Source & CC BY 4.0 licence ↗
Readings are shown in Irish local time. Gaps are left visible.
Preparing the chart…
Hover or tap the chart to inspect a reading.
Most recent 60 rows in this view. Download the CSV for every row in the selected period.
| Observation | Value | Coverage |
|---|
Unchecked OPW readings. Scout the river and assess conditions with your group; a gauge reading is not a green light. Planning notes ↓
Alex’s river notebook / Newcastle to Ballymahon
Newcastle Bridge to Ballymahon. Tap the map or open a feature for Alex’s local notes.
Hover, focus or tap a number to explore
Eddies, a wave and a first chance to play
Alex describes a river-left wave beneath a tree, with central rocks making useful eddies at low water. A river-right eddy offers a place to work on breaking in and out. Upstream eddy-hopping on the right can be an exercise for advanced beginners with suitable supervision. Inspect the tree and any trapped branches before considering that left-hand wave.
At different levels Low water exposes the central rocks. Eddy shape and the wave change with flow; the tree is a hazard to assess, not a target to approach.
A little eddy-spotting challenge
Two rocks upstream offer eddies, followed by a surf wave at a rock left of centre. A large river-left eddy sits behind a rock and tree. Alex’s challenge here is to spot and catch around fifteen eddies, where conditions and the group allow. The exact count is less important than a deliberate entry and a clear exit.
At different levels The usable eddies depend on the day. Check the rock and tree margins, downstream recovery space and whether each intended move is appropriate.
The first of the two drops
On the approach, Alex describes a river-right eddy at the corner and a small standing wave on the left. The upper drop itself has a river-right stopper, a smaller central stopper and a left eddy line with space to pause. Assess both drops before committing; they sit close together.
At different levels Check the stoppers, available stopping places and the route into the lower drop. The approach wave is a descriptive landmark, not an assurance that either drop is suitable.
A second drop, with a right-hand play hole
At the lower drop, Alex describes left or right lines and a right-hand play hole. Depending on level, that hole can offer direction changes, flat spins, pop-outs and cartwheels for appropriately skilled paddlers. Entry and exit can be challenging, and there are rocks to avoid.
At different levels Low water brings rocks and shallow landings. Scout the drop, retention and recovery options; a play move in these notes is not a recommendation at today’s level.
The play feature after Double Drop
After a river-wide slide, the surf wave is usually on the right, or may extend across the river depending on level. A smaller hole on the left can offer flat spins and cartwheels. Eddies on both banks make this a popular play spot in Alex’s notes. Give paddlers space to leave a feature before joining it.
At different levels Wave width, hole behaviour and eddy access change with level. Inspect both the feature and the downstream run-out before choosing to play.
A river-wide feature on the way down
The next unnamed rapid spans the river and is usually paddled through in Alex’s experience. Keep the group connected and continue looking for obstructions and usable eddies. “Usually” is doing some work in that sentence.
At different levels No specific play feature or preferred line is recorded here. Read the water in front of you rather than following an assumed route.
The last feature in this notebook
Most of the flow runs to river right, with an eddy in the middle. At some levels, a wave forms in the chute or a stopper appears centrally. Ballymahon Bridge marks the end of this sequence; agree and check your actual landing and access before setting off.
At different levels The occasional wave or stopper is level-dependent. Check the central feature and your exit from the bank; the bridge label is not a marked take-out.
Alex’s local observations, mapped 23 October 2026; not current conditions or recommended levels. Some names are working titles. Photos and drone views of the actual features will be added as they become available.
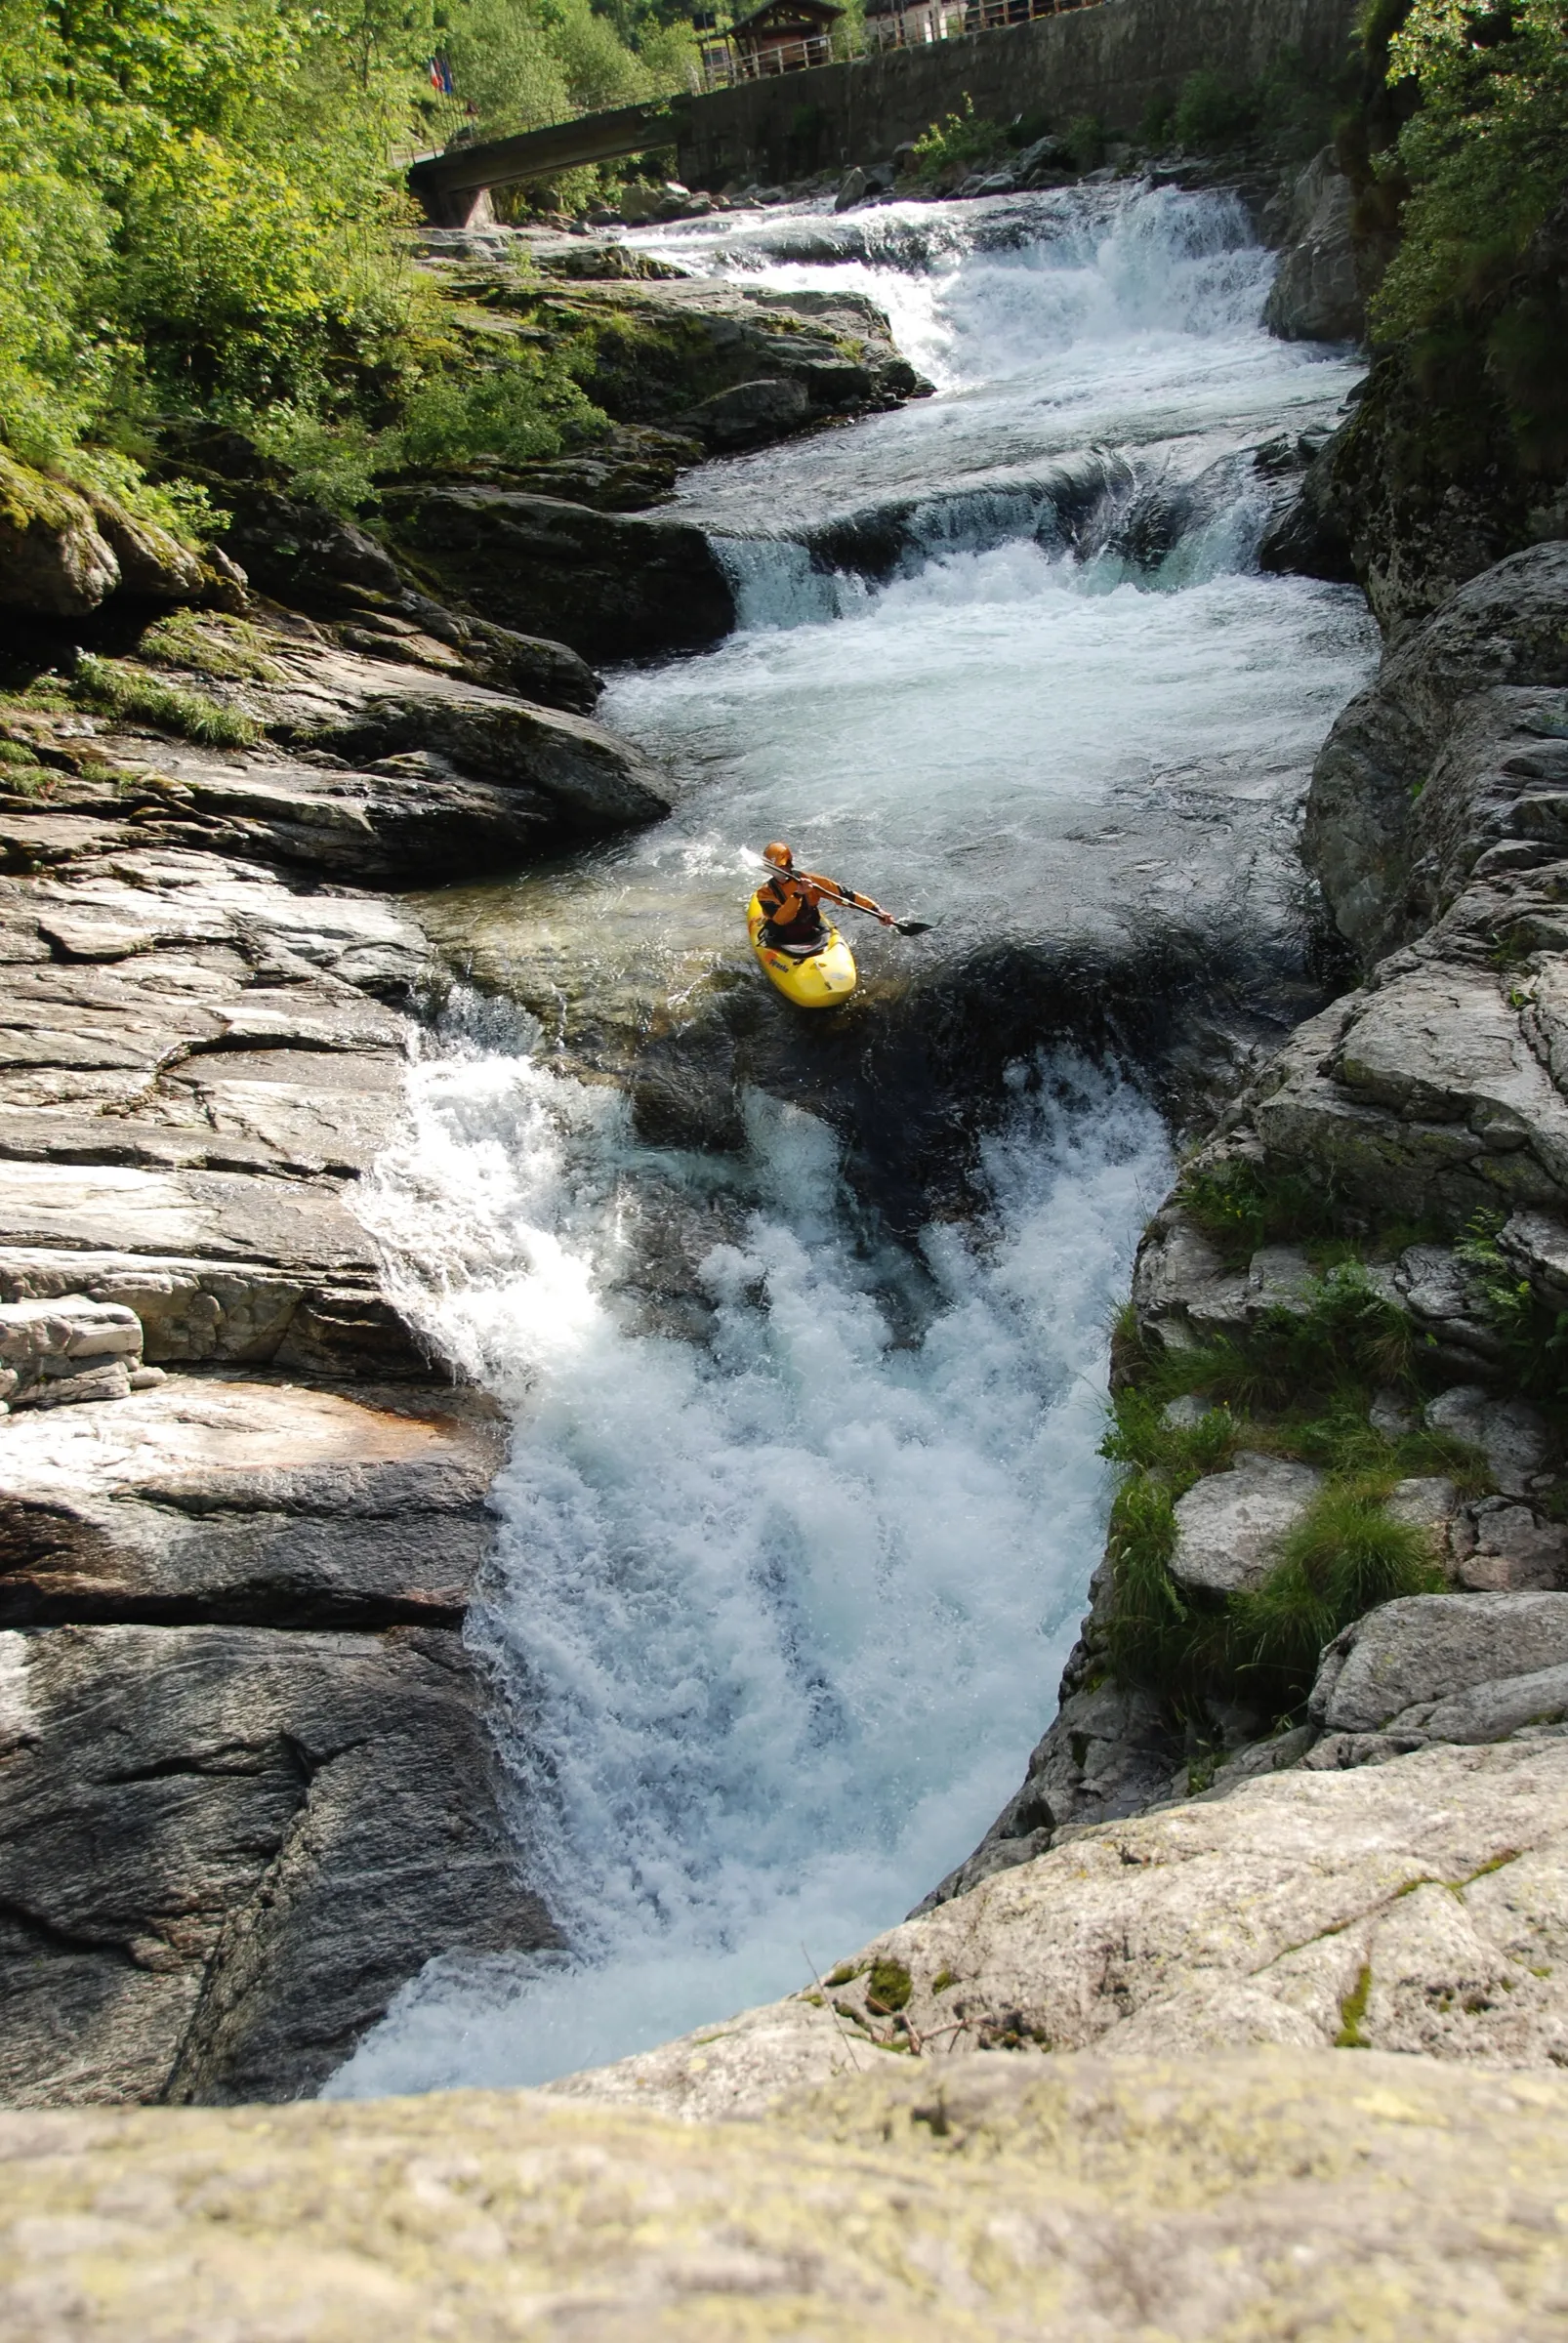
A little less upside down
A practical guide to the skill you’re always glad you practised.
Explore the rolling guide ↗Look beyond the next bend
Records, upstream trends and rainfall — when you want to look a little deeper.
Published level records / current gauge site
—
Loading OPW archive…
—
Loading OPW archive…
Checking the published daily maximum and minimum series.
These are extrema from OPW’s daily maximum/minimum series, not daily averages. We start in 1976 because the gauge moved in 1975. Dates are UTC source dates; exact times of day are not supplied here. Historical and recent readings may be revised.
Loading OPW upstream observations…
| Station | Latest gauge height | 3 hours | 6 hours | 24 hours |
|---|
Gauge zeroes differ, so absolute heights cannot be compared between stations. Trend values are suppressed when readings are more than two hours old. Ballinalack is affected by backwater from Lough Iron and is not being treated as a flow gauge.
Potentially. We first need to compare historical rises at these stations with later changes at Ballymahon, then test the relationship on separate dates. A useful model must outperform simply assuming the current level will persist, report its uncertainty, and stop producing forecasts when its inputs are missing or stale. Lake storage, tributaries and changing ground conditions can alter the delay. This page currently shows observations, not a forecast or a fixed travel-time rule.
Historical comparison / daily observations
Choose an upstream rain gauge and compare its daily record with level or flow at Ballymahon. Both graphs share the same dates. Use the cursor to inspect a rain event, then move forward to see the river’s response.
Loading the latest published upstream rainfall archive…
Hover or tap either graph to compare the same date.
These rainfall archives are published with a delay; they are not live rain gauges. Rainfall dates represent 09:00 UTC to 09:00 the following day, while the river means use calendar days. They support day-scale exploration, not an exact hourly lag. Flagged estimates are identified in the cursor and table; missing or investigation-required readings remain missing. One gauge does not measure the whole catchment.
| Date (source label) | Rainfall (mm) | Rain flag | Flow (m³/s) | River coverage |
|---|
Sources: Met Éireann Ballyjamesduff rainfall · Coole rainfall · Rainfall quality flags · OPW river observations · EPA Inny catchment description. Contains public-sector data under CC BY 4.0; this page’s comparisons are independent of the source agencies.
Check the Met Éireann warnings, agree the run with your group, and scout features and exits on site. Assess changing flow, obstructions and rescue options. Dress for immersion; the sensor temperature is not a clothing recommendation.
Numeric paddling bands are not calibrated yet. Pair a dated feature photo with the gauge reading, trend and your observations. Daily averages smooth out highs and lows; use the recent trace for recent changes. A blocked line is still blocked when the chart looks lovely.
We check OPW when this page loads or you press refresh, and cache successful responses for up to 15 minutes. “Recent” means an observation no more than two hours old. Older observations are labelled delayed; after 24 hours they are labelled stale. These are this page’s display rules, not OPW guarantees. The time beside a reading is when it was observed, not when this page fetched it.
The live graph reads the same OPW Hydro-Data feeds as the Ballymahon explorer (station ID 11668, station number 26021). Level and flow are normally published every 15 minutes; gauge sensor temperature is hourly. The JSON feeds expose roughly one month of source readings. Longer and older date ranges use the archive’s daily means. “Hourly means” and recent “Daily means” are calculated from the available source readings, with incomplete intervals flagged. OPW reports historical levels relative to Ordnance Datum; this page subtracts the station’s published gauge-zero elevation to display metres above gauge zero, matching the recent feed’s units. The current datum is 41.506 m, Malin Head OSGM15. The chart also shows the datum used in its response. We start in 1976 because OPW records the gauge being relocated in 1975. Channel changes and gauge history still limit comparisons across decades.
Daily coverage below 100% is flagged in the table and chart summary. Missing values remain gaps. OPW quality codes are retained in the CSV, but we do not interpret them as approval or assurance.
OPW publishes the series as water temperature, but warns that the sensor may be heated in warm weather and may not represent the waterbody. We therefore call it gauge sensor temperature. Air temperature is not being substituted for a missing reading.
Contains Irish Public Sector Information licensed under Creative Commons Attribution 4.0. Source: waterlevel.ie, provided by the Office of Public Works. This independent page filters, charts and converts the published data; it is not an OPW product or endorsement. API terms · OPW data limitations · Historical data documentation · This station in the OPW explorer.
May I use analytics to improve the site and LinkedIn advertising cookies to show relevant consulting and Elevated Seller ads? Choose either, both or neither. Newsletter signup is separate. How tracking works.
Essential: remembers your choice for 180 days.